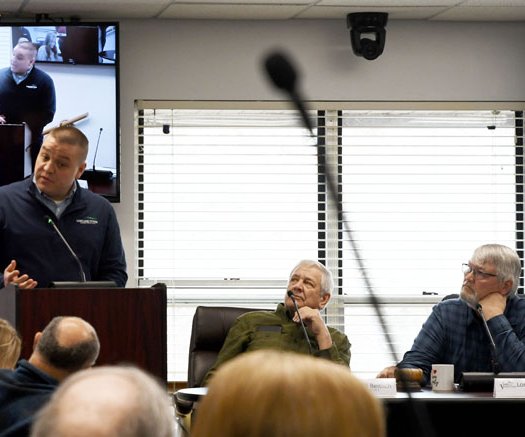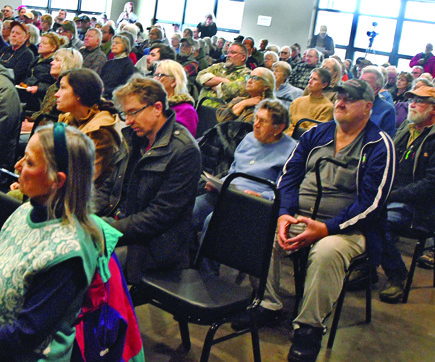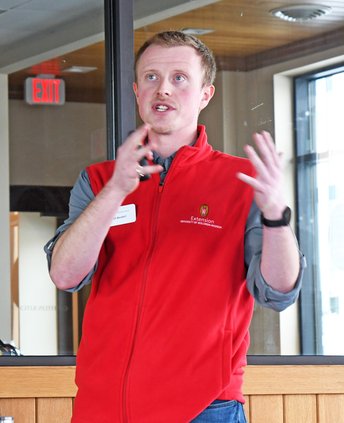
Monroe County Climate Change Task Force (CCTF) gathered about 50 citizens at the Bank of Cashton on February 21 to hear a variety of presentations helping residents to understand how to be more resilient in the face of climate change. Josh Bendorf, Climate Outreach Specialist with the State Office of Climatology, presented a ‘Monroe County Climate Summary.’
“We do these climate summaries for counties on a per-request basis,” Bendorf told the group. “Monroe County is one of our Central Wisconsin reports along with La Crosse County, and for counties in Southern Wisconsin, we’ve done Vernon and Sauk counties in the western part of the state.”
Bendorf agreed that he would work on reports for Crawford and Richland counties in response to a request from the Independent-Scout to complete summaries for all counties that are part of the Kickapoo River Watershed. That river’s headwaters are located in Monroe County.
“These reports are part of project I've been leading up that we call County Climate Profiles,” Bendorf explained. “The State Climatology Office is the main like climate record keeper in the State of Wisconsin. We have climate data for the whole state, all 72 counties, going back to pre-1900, and so we wanted to take this data that we have archived and compile it into these county level reports.”
County Climate Profiles can be found online at: https://climatology.nelson.wisc.edu/county-climate-profiles/.
Bendorf also highlighted different reports and services that can assist municipalities, and farmers and landowners pursue greater resilience in the face of climate change impacts. Those resources include:
• Ag Weather Outlook for Wisconsin – monthly in winter, and weekly during the growing season (https://cropsandsoils.extension.wisc.edu/wisconsin-ag-weather-outlook/)
• Wisconet Network – real time (updated every five minutes) above ground air temperature and wind speed, and soil moisture and temperature at different depths going down to 40 inches (https://wisconet.wisc.edu/)
Monroe summary
The sixteen-page climate summary for Monroe County contains pages on:
• Averages and Records
• Temperature Trends
• Temperature Top 10
• Precipitation Trend
• Precipitation Top 10
• Extreme Heat
• Extreme Cold
• Extreme Precipitation
• Hazards Summary
• WICCI Projections
• USDA Midwest Climate Hub
• Ag Weather Outlook for Wisconsin
• Wisconet
Averages, records
Bendorf told the group that for Monroe County, using recent seasonal averages from 1996 to 2025 (last 30 years), annual temperatures have increased at a rate of about one degree Fahrenheit every 25 years, with warming the most pronounced during the winter months.
He said that in summer, along most of the other seasons, low temperatures have been warming at a similar or faster rate compared to high temperatures, especially during the summer and winter months. He said they have also seen a substantial increase in overnight temperatures and a substantial decrease in extreme coldest temperatures.
“Going back to data from 1895, the 10 warmest years have all occurred in the last 20 years of data,” Bendorf explained. “The Top 10 coldest years all occurred a long time ago, with the exception of 2014.”
Bendorf said that annual precipitation has been increasing at a rate of about an inch per decade, a 21% increase since the early-to-middle 1950s, with summer seeing the largest increase in terms of inches per decade.
“But winter is actually the season with the largest increase, percentage increase in precipitation – about 31%,” Bendorf shared. “Summer tends to be our wettest time of year, and winter is our driest. So even a little bit of increase in winter precipitation is more significant compared to summer.”
Bendorf said the three wettest years of all time are clustered within the last 10 years or so, with the top 10 a little bit more spread out than for temperature.
“If you look at the top 10 driest years, you have to go back 50 years to the last time we had a year that ranked in the top 10,” Bendorf said.
He explained that Monroe County is most likely to experience extreme heat (above 90 degrees during the day and 70 degrees at night) in the last week of July, and extreme cold (at or below 10 degrees) in the month of January.
Based on historical data and averaging things over the last 20 years, Monroe County sees on average, 13 hot days per year, and six warm nights per year. He said that on average, the county has seen 10 very cold days and 29 very cold nights per year.
Precipitation trends
Bendorf said that for precipitation trends, his team had analyzed those by month.
“We can have extreme precipitation events at all times of year, but about 82% have occurred in the months of June through September,” Bendorf explained. “Temperature and moisture in the atmosphere are very closely linked. June has stood out a little bit more as our month of most frequent heavy precipitation days, but months like July and August don't fall too far behind. On average, Monroe County has had 17 heavy precipitation days per decade, and of the counties we've looked at so far, that's one of the highest values.”
In total, five watersheds have their headwaters in Monroe County: Kickapoo River, West Fork Kickapoo River, Pine River, Lemonweir River and the Upper Baraboo River.
Bendorf said that an analysis of hazards impacting Monroe County goes back to 2005, using data provided by his office’s partner, the National Weather Service. The data looks at weather advisories issued to the public by NWS.
“Not surprisingly, during the winter months, winter weather advisories and warnings are for things like snowfall or freezing rain, which are the most common hazards,” Bendorf said. “January is very most likely to see severe cold events, and we see, on average, two frost freeze advisories during the month of May.”
Climate projections
Bendorf said the climate projections contained in County Climate Summaries are for mid-century under moderate greenhouse gas emissions, with temperatures continuing to increase by about four degrees compared to recent averages.
“According to our models, winter will warm by a little bit more than other seasons, with a decrease in the number of nights that drop below zero,” Bendorf shared. “ Currently, you've got about 30 of these per year, and that's projected to be in the ballpark of about 10 by mid-century.”
Bendorf says the models show an increase in number of night warm nights and an increase in days that top 90 degrees. He said that days with temperatures that top 100 are more rare and don’t happen every year, but are expected to occur at least once per year by mid-century.
“Summers are projected to be five percent drier, but even with summers projected to be slightly dry, that can be a little bit deceiving, because that's also the time of year when we're most likely to see heavy precipitation events,” Bendorf said. “Those are projected to actually increase, with a higher frequency of those two inches or more rainfall events. So, even though things are meant to get a little bit drier, you might actually get more of our precipitation occurring during those high impact rainfall events.”
The Independent-Scout asked if their data is showing an increased incidence of fire weather in the winter months? Independent-Scout pointed out that in Southwest Wisconsin, on Wednesday and Thursday, February 18-19, we’d had temperatures in the upper 50s to upper 40s, with high winds, total snow melt, leaf-off conditions on trees, brown winter vegetation, and all kinds of scary warnings about the risk for wildfires. And then, the Independent-Scout pointed out, residents woke up to 8.5 inches of wet snow.
“That is a great question, but not something that I have looked into,” Bendorf responded.
@font-face {font-family:Arial; panose-1:0 0 0 0 0 0 0 0 0 0; mso-font-alt:Helvetica; mso-font-charset:77; mso-generic-font-family:swiss; mso-font-format:other; mso-font-pitch:variable; mso-font-signature:3 0 0 0 1 0;}@font-face {font-family:Times; panose-1:0 0 0 0 0 0 0 0 0 0; mso-font-alt:"Times Roman"; mso-font-charset:77; mso-generic-font-family:roman; mso-font-format:other; mso-font-pitch:variable; mso-font-signature:3 0 0 0 1 0;}@font-face {font-family:Times; panose-1:0 0 0 0 0 0 0 0 0 0; mso-font-alt:"Times Roman"; mso-font-charset:77; mso-generic-font-family:roman; mso-font-format:other; mso-font-pitch:variable; mso-font-signature:3 0 0 0 1 0;}@font-face {font-family:"MS Mincho"; mso-font-alt:"YuGothic Medium"; mso-font-charset:128; mso-generic-font-family:modern; mso-font-pitch:fixed; mso-font-signature:-536870145 1791491579 134217746 0 131231 0;}p.MsoNormal, li.MsoNormal, div.MsoNormal {mso-style-unhide:no; mso-style-qformat:yes; mso-style-parent:""; margin:0in; margin-bottom:.0001pt; mso-pagination:widow-orphan; font-size:12.0pt; font-family:"Times New Roman","serif"; mso-fareast-font-family:"MS Mincho"; mso-bidi-font-family:"Times New Roman";}a:link, span.MsoHyperlink {mso-style-priority:99; mso-style-parent:""; color:blue; text-decoration:underline; text-underline:single;}a:visited, span.MsoHyperlinkFollowed {mso-style-noshow:yes; mso-style-priority:99; color:purple; mso-themecolor:followedhyperlink; text-decoration:underline; text-underline:single;}.MsoChpDefault {mso-style-type:export-only; mso-default-props:yes; font-size:10.0pt; mso-ansi-font-size:10.0pt; mso-bidi-font-size:10.0pt; mso-fareast-font-family:"MS Mincho";}div.WordSection1 {page:WordSection1;}