
LAFARGE - John Wetenkamp is a Service Hydrologist with the National Weather Service (NWS) office out of LaCrosse. He began in the job just before the August 2018 historic flooding event, and safe to say, had a crash course in the magnitude of flooding the area could deliver.
In a presentation to a group of about 40 citizens gathered at the Kickapoo Valley Reserve Visitor’s Center on Wednesday, Sept. 25, Wetenkamp explained how flood forecasting works. The presentation was part of a series sponsored by UW-Madison CALS and the Kickapoo Nuzum Fund called ‘Driftless Dialogues.’
“Flood forecasting for the Kickapoo River Valley is extremely challenging,” Wetenkamp said. “The excessive rains the area has experienced in recent years along with the steep gradients in the terrain make our job very complicated.”
In addition to heavy rain, flooding conditions can also develop with snowmelt over frozen ground or even winter rain, and are also complicated by saturated soil conditions even when the ground is not frozen. Basically, frozen or saturated ground means there is nowhere for the water to go, and runoff will increase.
Wetenkamp explained that in forecasting, his team fulfills the human role of synthesizing all the information available, and making the call about what kind of warning or watch to issue.
The information sources used by the team include computer models, radar, river gauges, soil saturation data and current river levels. All of these go into the ultimate judgment calls the NWS team makes, and each has its strengths and challenges as a type of information.
“Determining where the heavy rain will fall in a rain event is the job of a human forecaster, not just a computer model,” Wetenkamp explained. “When we issue a flood, flash flood, or flash flood emergency warning, it is often difficult to make an accurate prediction more than three-to-six hours out.”
River gauges
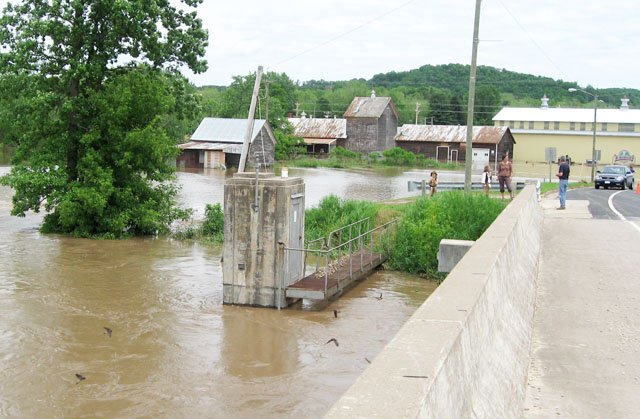
River gauges along the Kickapoo River are maintained in a central database by the U.S. Geological Survey (USGS). The best, most state-of-the-art gauges are the in-stream variety provided directly by USGS. The units are very expensive, and provide real-time information about river levels and rates of flow. Rates of flow are expressed as ‘cubic feet per second,’ (cfs).
The USGS Groundwater and Stream Flow Information Program supports the collection and (or) delivery of both stream flow and water-level information for more than 8,500 sites and water-level information alone for more than 1,700 additional sites.
The stream gauges are primarily operated and maintained by the USGS, but most are funded in partnership with one or more of about 1,400 Federal, State, local, and Tribal agencies or organizations. This unique cooperation results in nationally consistent and impartial data that also aids local decision making.
The shared costs result in the operation of far more stream gauges than would be possible if financed solely by USGS appropriations, which provide less than one-third of the needed funding. These partnerships also enable fixed costs (such as costs associated with data storage and delivery infrastructure) to be broadly distributed, resulting in more economical stream gauging information for all.
In the Kickapoo Valley, USGS has these premium-type river gauges in Ontario, LaFarge and Steuben. The gauges in Ontario and LaFarge had become endangered in the early 2000s, according to KVR Executive Director Marcy West.
“Because we run a recreational facility, with people using the river and camping on the property, having real time information about what is happening on the river is crucial to public safety,” West said. “It is also crucial to our communities.”
West explained that the gauge in LaFarge is the longest standing monitoring station in the Kickapoo Valley. Because of budget cuts to USGS around 2002-2003, there was a plan to remove the LaFarge gauge. The KVR determined that the gauge was a critical asset, and has since that time made a $5,200 annual contribution to the $11,900 total cost of long-term maintenance for the station.
The Ontario gauge, which is considered to be equally critical as it is located in the watershed’s headwaters, was also threatened in the same timeframe because of a reconstruction project along Highway 131 between Rockton and Ontario. Fortunately, this gauge was also saved and is administered by USGS to this day.
In Readstown, there is a gauge, similar to the ones used by USGS that is maintained and monitored by the National Weather Service. In Viola, Soldiers Grove and Gays Mills, the gauges are what is described as ‘manual.’
‘Manual’ means that an individual, typically a village employee like Jim Chellevold in Gays Mills or Ben Lathrop in Soldiers Grove have to physically travel out to the river at some agreed upon location and schedule to take a physical measurement of the river height using a ‘weight and cable drop.’ The measurements are taken regularly on a weekly or bi-weekly basis, and more frequently when heavy rain and flooding are in the forecast. Those results are reported back to USGS.
USGS staff is involved in periodic evaluations of the monitoring sites along the river where measurements are taken in order to keep up with any shifts in the river course that may occur over time.
“USGS staff will evaluate the measurement sites using survey equipment to measure elevations on a regular basis,” Wetenkamp explained. “In addition, they will consult with local emergency management about any changes in the monitoring site.”
Types of warnings
Wetenkamp discussed with meeting participants the two different kinds of flooding, as well as other ancillary impacts such as mudslides and ice jams.
The two types of flooding are flash flooding and river flooding. In the aftermath of the August 2018 floods and the breaching of five flood control dams in the Coon Creek and West Fork headwaters, a new ‘Flash Flood Emergency’ warning has been added to the lineup.
Different types of warnings with different levels of urgency will be issued in each of these types of situations. Obviously, with a Flash Flood Emergency or Flash Flood warning, there is an immediate threat to lives and property, and immediate action is required. Typically flash floods arise and subside very rapidly.
“A flash flood warning means that flooding is expected to begin within six hours, but really it means that it could begin within two hours,” Wetenkamp said.
River flood warnings on the other hand, are warnings that communities and individuals can expect river flooding and should use the time available to prepare. This is the scenario where you will see communities filling and placing sand bags, people moving property and loved ones out of the floodplain. Often, it is possible for a community to watch the water coming down the river for several days before the worst impacts are experienced.
“A river flood warning means that flooding will commence in more than six hours,” Wetenkamp said.
During a heavy rain and flooding emergency, forecasters rely upon all of the tools available and regular updates from automated and manual gauges to refine the information they push out through their various media channels. Those channels include television, radio, weather radio, text alerts, and social media.
“We use information from radar to help us forecast, but there can be problems with radar,” Wetenkamp said. “In trying to understand what is happening with rivers, it often gives confusing information because it involves a satellite bouncing off of water. Sometimes, we have trouble telling if what we are seeing is rain or hail, for instance.”
For this reason, forecasters like Wetenkamp find the data from the automated and manual gauges to be of inestimable value. They will also monitor the first responders radio networks in areas where flooding is forecasted to get a real time fix on what is actually happening on the ground in those areas.
When it comes to impacts like mudslides and ice jams, one thing that helps forecasters predict these things is historical knowledge of where they have happened in the past.
“Mudslides and ice jams tend to recur in the same areas, so we know where to be concerned about and who to call for up-to-date information,” Wetenkamp said.
On any given day, and particularly when a severe weather situation is shaping up, the NWS forecast office in LaCrosse will keep a log of their ‘forecast discussions’ on their forecast page for the area. That log can be found at https://forecast.weather.gov/product.
Driftless Dialogues
The next in the series of ‘Driftless Dialogues’ will be ‘Wisconsin Rocks! A Guide to Geologic Sites in the Badger State.’ The talk will take place at he KVR on Wednesday, Oct. 30, with socializing at 6:30 p.m., and the talk at 7 p.m. Participants will listen as Scott Spoolman, a science writer who focuses on the environmental sciences, shares about 52 of the best geologic sites in the state included in his book, ‘Wisconsin Rocks – A Guide to Geologic Sites in the Badger State.’ Scott will introduce the book by sampling some of the sites during his talk and presenting several of his own photos from the book.

