By GILLIAN POMPLUN
DRIFTLESS - Going into the Fourth of July Weekend, with celebrations planned to mark the 250th Anniversary of the signing of the Declaration of Independence, heavy rain and flooding kept some residents with an eye on the sky.
In the wee hours of Wednesday, July 1, Gays Mills picked up a quick inch of rain. This was followed by on-and-off waves of heavy rain throughout the day, putting down another four inches. Areas to the north, and in northwest Iowa and Minnesota exploded with flash flooding. Portions of the Interstate in southeast Minnesota were closed for a period of time.
By late afternoon of July 2, water in the Kickapoo River at Ontario had risen to 18.35 feet – a moderate flood, just under the major flood elevation of 19 feet. Water was reported covering the intersection of Highways 131 and 33. Lower Coon Creek rose rapidly, with the Vernon County Sheriff reporting water over the road in Lower Chaseburg.
Baker Creek experienced a rapid rise, flooding areas near Solar Meats and Campbell’s One Stop in Soldiers Grove. According to village clerk Kaitlynn Ott, a culvert became blocked, depositing sediment and debris onto Highway 61. The highway was shut down for a period of time while cleanup ensued. Ott also reported a picnic table, anchored in concrete near Solar Town Farm and Home was torn out, indicating the strength of the flow on Baker Creek.
Recent streambank work on the reach of Baker Creek behind the Fire Station was in its final stages, without growing vegetation, and it is unclear how that was impacted. The project is part of the sewer system upgrade in Soldiers Grove, as a water quality trading initiative designed to reduce phosphorous entering the creek from soil erosion.
Vera Stussy posted pictures on Facebook of high water across the road near her home from the Nederlo Creek tributary of Tainter Creek.
Vernon Reporter shared a story of heavy rainfall of about six inches on July 1-2 led Viroqua city officials to release approximately 18,000 gallons of wastewater into nearby waterways on July 2 to prevent sewer backups in homes and businesses.
By late afternoon on Friday, July 3, the National Weather Service was forecasting a moderate flood in and around Gays Mills, with a crest of 15.50 feet expected between July 4 and 5. Fortunately, subsequent rainfall events came relatively widely spaced, with recovery time in between, and in lesser amounts than seen on Wednesday.
The Stump Dodger Bash was able to go on as planned, with only a fairly short-lived bout of heavy rain in the late afternoon on Saturday, depositing about two-thirds of an inch of rain. Later, Gays Mills was treated to a spectacular fireworks display, commemorating the nation’s 250th Anniversary, put on by the Gays Mills Fire Department.
New NWS maps
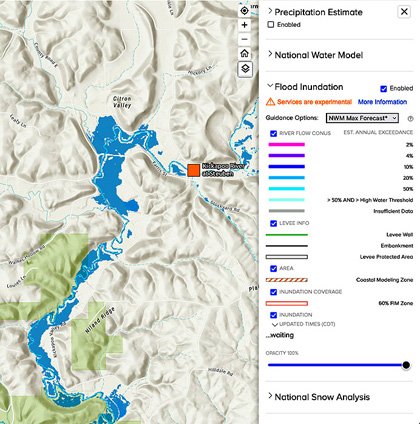
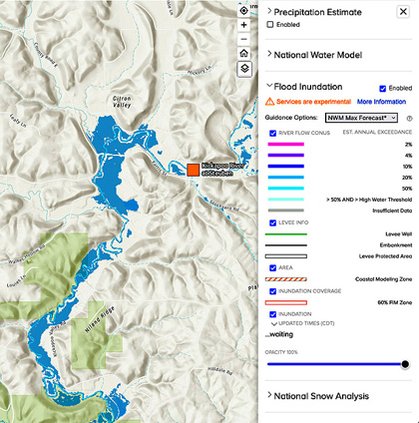
At their April meeting, the Monroe County Climate Change Task Force heard from National Weather Service Hydrologist Jordan Wendt about development of Flood Inundation Maps (FIM) for rivers of Driftless Area. The project is part of a larger project to create the maps as part of the development of the National Water Model.
According to Wendt, the maps are available for Southwest Wisconsin now, and can be found at:
Once the map comes up, and you select the kind of map you want (this will be explained in detail below), then you simply use the ‘+’ button at the top right of the screen to continue to zoom in on the map until you can start to see the flood inundation appear on the screen.
The maps show what areas can be expected to be impacted by floodwaters for the different flood stages typically reported on by NWS – action, minor, moderate and major. They can be used by citizens and municipalities to make plans in the event a flooding situation takes place.
The maps show the extent of area expected to be covered in floodwaters, but not the expected depth. The visualization, combined with a street base map allow communities and decision makers to understand their potential flood risks for preparation and response.
“The backbone of our agency’s flood inundation maps development process is the creation of the National Water Model (NWM),” Wendt explained to the group. “The NWM, while still in its infancy, lays the groundwork for automatically forecasting over 2.7 million river reaches (roughly 3.2 million river miles) across the U.S. Bear in mind, there are about 3.4 million river miles in the country.”
The model NWS is using to develop the maps is called ‘Height Above Nearest Drainage’ (HAND). This is a ten-minute digital elevation model, applied to form a grid of regions on a river, and the area that drains to it. Different points within the area will be assigned the flood stage at that location required before it would be covered in floodwater.
Strengths/weaknesses
Wendt said the strengths of the HAND model for developing the flood inundation maps is that it is a reliable and relatively low cost method.
What it doesn’t do is evaluate hydraulically (the mechanics of water flow such as water surface elevation, velocity, and depth). Nor, Wendt explained, does it take into account topography under the water. He said the model can become inaccurate near levees, does not account for backwater effects, and has trouble accounting for waterbodies such as lakes located within a river system.
“During Hurricane Harvey, the visual communication tool NWS had to convey potential flood inundation areas was a map with polygons, and the new flood inundation maps would have been more effective,” Wendt explained. “The new maps are better at helping decision-makers decide on evacuations, plan how first responders move through a flooded area, and estimate what the worst case scenario could be for any given flooding event.”
Static v. Dynamic
Wendt explained that there will be two types of flood inundation maps available – static and dynamic. He said a static map would always be available, whether the river is flooding or not.
“Dynamic Flood Inundation Maps will become available automatically when river levels exceed a ‘high water’ threshold based on latest river forecasts from the River Forecast Center (RFC), or automated National Water Model (NWM) forecasts, as well as a ‘currently flooded’ view based on the latest observations,” Wendt explained. “It will convey a maximum extent forecast, as well as latest analysis by the NWM.”
In the event a flooding situation comes to pass, two types of dynamic 5-Day Maximum Inundation forecasts and maps will become available. One will have a human-derived river forecast from the River Forecast Center (RFC 5-Day Max). The other will be automatically generated with no human forecaster involved (NWM 5-Day Max).
The RFC 5-Day Max inundation forecast and map will depict the maximum area expected to be covered in floodwaters, and will become available to the public roughly 45 minutes after the forecast is issued. It will be directly based on a human-derived RFC forecast, but its limitation is, it will only cover five miles downstream of the forecast location.
The NWM 5-Day Max inundation forecast will depict the area expected to be covered in floodwaters for each of the flood stages defined by National Weather Service (action, minor, moderate, and major). Updates will be available four times daily at approximately 1:30 a.m., 7:30 a.m., 1:30 p.m. and 7:30 p.m. The forecast’s limitation is that it will be automatically generated, with no forecaster involved.
Lastly, the other dynamic forecast product that will be generated will be a ‘latest analysis’ incorporating recent rainfall and observed river stage information. These updates will become available about 80 minutes after each hour. The reliability of these updates decreases in areas with no river gauge.
Wendt cautioned that the maps will not be perfect, and can suffer from inaccuracies due to several factors:
- River forecasts drive the maps, and if the forecast is wrong, the map will be too
- Maps are based on land use conditions at the time they were developed – man-made changes along a river will impact the map’s accuracy
- Maps assume permanent flood protection measures such as levees, floodwalls or dams will survive a flood
- Maps only depict area to be flooded, and not how deep the water will be
- If a human is not involved, the maps generated won’t adjust based on varying precipitation forecasts.